Cavitation
Cavitation is the formation and subsequent collapse, within a liquid, of cavities or bubbles that contain vapor or a mixture of vapor and gas (ASTM-G32). In the presence of an ultrasonic field, this growth and collapse typically occurs during a small number of ultrasonic cycles. The collapse of these bubbles causes locally intense pressures and temperatures.
Estimated power (water)
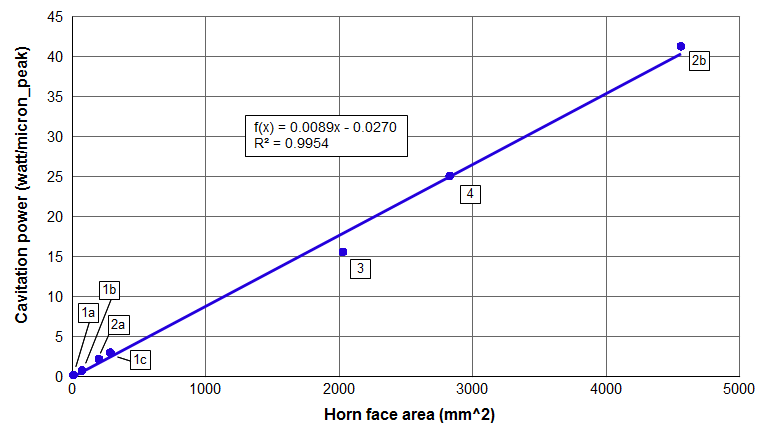
For a horn with a circular face, the cavitation power in degassed water at room temperature can be estimated from the following graph.
|
|
|
|
||||||||||||||||||||||||||||||||
|
Notes —
- Method 1 = Wattmeter measuring net power. The net cavitation power to the fluid is the total input power to the transducer during cavitation minus the power loss in the ultrasonic stack. As an approximation, the loss in the ultrasonic stack is taken as the no-load power of the ultrasonic stack (i.e., the power when running in air). However, it is known that the power dissipated by the transducer's ceramics increases as the delivered power increases so the no-load approximation of stack loss is too low. Hence, the calculated net cavitation power will be somewhat too high. The error increases as the delivered power increases. However, the error should not be large.
- Method 2 = Calorimetric. The temperature rise of the water is measured over a specified time. From this the cavitation power can be calculated based on the water's specific heat and volume.
- Peshkovsky's data was measured at 17.8 kHz. In order to be consistent with the other data, Peshkovsky's data has been extrapolated to 20 kHz under the assumption that the power per unit amplitude increases linearly with frequency (i.e., the power per unit velocity is constant, regardless of frequency). This assumption awaits verification.
- If the horn's face amplitude is not completely uniform then the horn's average face amplitude should be used to calculate the power from figure 1 (since the cavitation power varies linearly with amplitude).
- Although the data from figure 1 were taken for cylindrical horns, the regression equation would likely apply approximately for rectangular horns provided that the horn's thickness is somewhat comparable to the width.
The cavitation intensity can be taken from the slope of the graph — i.e., 0.89 watt/micron_peak/cm².
Cavitation is affected by numerous parameters. Fluid properties include vapor pressure, surface tension, viscosity, and density. External factors include temperature, the number of cavitation nuclei (suspended particlas and dissolved gasses), and the shape and proximity of the fluid container. Thus, figure 1 should only be used as a rough estimate of the expected cavitation power. If the fluid is not water then figure 1 would not apply.
Example
Assume a 20 kHz Ø50 mm horn with a face amplitude of 50 microns_peak. (At this diameter the face amplitude is nearly uniform so no averaging of the face amplitude is needed.)
The horn's face area is 1963 mm2. From the equation from figure 1, the cavitation power is 17.4 watt/micron_peak. Then at 50 microns_peak the estimated cavitation power is 870 watts (round up to 900 watts). This is the net cavitation power alone. Additional power would be needed to drive the ultrasonic stack.
Effect of temperature
The above data are for water at room temperature (25°C). However, as the temperature increases the cavitation power at a given amplitude decreases. For example, see Raso[1] and Löning[1] for water and Kobus[2] for various oils.
Effect of amplitude
One might expect that cavitation power would vary with the square of the amplitude (similar to the \( I^2 R \) law for a resistor). This would be true if the cavitation resistance were independent of input amplitude. In fact, however, the resistance of the cavitating bubble cloud is not constant with amplitude. As the amplitude increases the number of bubbles at the face of the horn also increases; thus, the coupling of the horn to the liquid is reduced by the thicker bubble cloud so that the transfer of energy becomes relatively more difficult.
The following figure from Peshkovsky[1] (figure 9, p. 321) shows that cavitation power varies linearly with the horn's face velocity (and hence with amplitude) at a given frequency. Peshkovsky's frequency was 17.8 kHz. Note that Peshkovsky's velocity is RMS (root mean squared; multiply \( V_{RMS} \) by \( \sqrt{2} \) to convert to peak velocity).
|
|
|
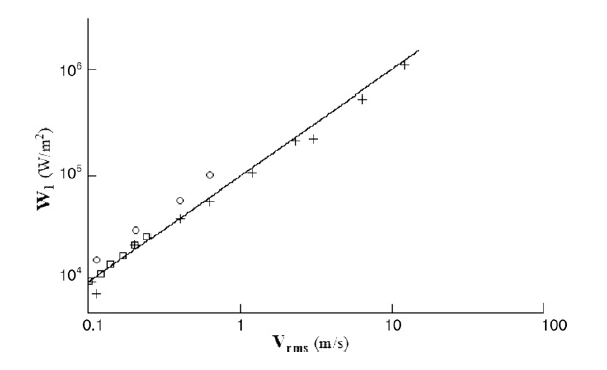
Note: All data are at 1 bar [1 atmosphere = 0.1 MPa] except the circled data which are at 2 bars of pressure.
The equation of the line in figure 2 is (Peshkovsky, p. 321) —
\begin{align} \label{eq:14601a} W_1 &= P_0 \, V_{RMS} \end{align}
where —
| \( P_0 \) | = Static pressure [Pa] |
Effect of frequency
As the frequency increases, the time between successive ultrasonic cycles decreases. Therefore, the cavitation bubble has less time to grow before it collapses. Hence, higher frequencies result in smaller bubbles, each of which contains less energy. (As a first approximation, the bubble radius is inversely proportional to the frequency. See Leighton[1], eq. 11.1, p. 200; also, Piazza[1], eq. 1, p. 3.) On the other hand, higher frequencies yield more bubble collapses per unit time (for a give number of bubbles) and may may also result in greater bubble densities (bubbles per unit volume of fluid). The net effect on power is ... ?
Application
The above discussion of power is somewhat academic since applications are seldom conducted in room temperature water. Power is affected by additional factors including fluid viscosity, surface tension, and particulate concentration.